Wie kann ich die implizite Funktion
\pgfmathsetmacro\xA{0}\pgfmathsetmacro\yA{0}\pgfmathsetmacro\xB{1}\pgfmathsetmacro\yB{0}\pgfmathsetmacro\xC{0.5}\pgfmathsetmacro\yC{0.5*sqrt(3)}

f(x,y)=4*((x -\xA)^2 + (y - \yA)^2)*((x -\xB)^2 + (y -\yB)^2)
-(   ((x -\xC)^2 + (y -\yC)^2)
    -((x -\xA)^2 + (y -\yA)^2)
    -((x -\xB)^2 + (y -\yB)^2)     )^2;
zusammen mit dem (hier) gleichseitigen Dreieck
\addplot[no marks] coordinates {(\xA,\yA) (\xB,\yB) (\xC,\yC) (\xA,\yA) };
am besten plotten?
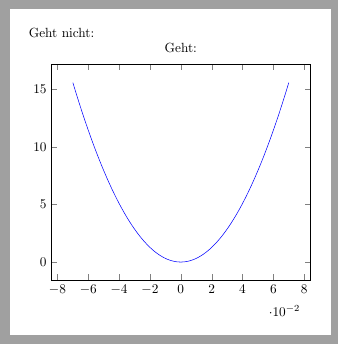
Im Fall hier müsste sowas wie ein Kreisbogen unter der Seite AB rauskommen.
Meine Versuche sind nicht so prima; ich kenne mich mit gnuplot (sofern hier übh. nötig?) nicht so aus.
3 MWEs (gnuplot muss im Pfad sein):

% arara: pdflatex: {shell: yes}\documentclass[margin=5mm, tikz]{standalone}\usepackage{pgfplots}\pgfplotsset{compat=newest}\begin{document}% Ecken\pgfmathsetmacro\xA{0}\pgfmathsetmacro\yA{0}\pgfmathsetmacro\xB{1}\pgfmathsetmacro\yB{0}\pgfmathsetmacro\xC{0.5}\pgfmathsetmacro\yC{0.5*sqrt(3)}% A(0,0); B(1,0); C(0.5, 0.5*sqrt(3))\begin{tikzpicture}\begin{axis}[axis equal,
title={$|AX| + |BX| = |CX|$},
]
\addplot +[%smooth,
no markers,
raw gnuplot,
thick,
%empty line = jump % not strictly necessary,
] gnuplot {
f(x,y)=4*((x -\xA)^2 + (y - \yA)^2)*((x -\xB)^2 + (y -\yB)^2)
-( ((x -\xC)^2 + (y -\yC)^2)
-((x -\xA)^2 + (y -\yA)^2)
-((x -\xB)^2 + (y -\yB)^2) )^2;
set cntrparam levels discrete 0,0;
set isosample 100,100;
set size square;
set view equal xy;
set cont base;
unset surface;
splot f(x,y);
};
\addlegendentry{$X$}\addplot[no marks] coordinates {(\xA,\yA)  (\xB,\yB) (\xC,\yC) (\xA,\yA) };

\draw[fill=white] (\xA,\yA) circle (1.75pt) node[anchor=north east]{$A(\xA,\yA)$};
\draw[fill=white] (\xB,\yB) circle (1.75pt) node[anchor=north]{$B(\xB,\yB)$};
\draw[fill=white] (\xC,\yC) circle (1.75pt) node[anchor=east]{$C(\xC,\yC)$};
\end{axis}\end{tikzpicture}\begin{tikzpicture}\begin{axis}[
view = {0}{90},
axis equal,
%     restrict x to domain = -2.2:3
]
\addplot3 [contour gnuplot = {labels = false}, samples=10]
{
2*sqrt((x -\xA)^2 + (y - \yA)^2)*sqrt((x -\xB)^2 + (y -\yB)^2)
-( ((x -\xC)^2 + (y -\yC)^2)
-((x -\xA)^2 + (y -\yA)^2)
-((x -\xB)^2 + (y -\yB)^2) )^1
};
\addlegendentry{$X$}\addplot[no marks] coordinates {(\xA,\yA)  (\xB,\yB) (\xC,\yC) (\xA,\yA) };

\draw[fill=white] (\xA,\yA) circle (1.75pt) node[anchor=north east]{$A(\xA,\yA)$};
\draw[fill=white] (\xB,\yB) circle (1.75pt) node[anchor=north]{$B(\xB,\yB)$};
\draw[fill=white] (\xC,\yC) circle (1.75pt) node[anchor=east]{$C(\xC,\yC)$};
\end{axis}\end{tikzpicture}\begin{tikzpicture}\begin{axis}[
      axis equal,
%      restrict y to domain = -4:4,
    ]
    \addplot + [
      no markers,
      raw gnuplot,
      thick,
      ]
      gnuplot {
f(x,y)=4*((x -\xA)^2 + (y - \yA)^2)*((x -\xB)^2 + (y -\yB)^2)
-( ((x -\xC)^2 + (y -\yC)^2)
-((x -\xA)^2 + (y -\yA)^2)
-((x -\xB)^2 + (y -\yB)^2) )^2;
        set contour base;
        set cntrparam levels discrete 0.01;
        unset surface;
        set view map;
        set isosamples 300;
        splot f(x,y);
      };
\addlegendentry{$X$}\addplot[no marks] coordinates {(\xA,\yA)  (\xB,\yB) (\xC,\yC) (\xA,\yA) };

\draw[fill=white] (\xA,\yA) circle (1.75pt) node[anchor=north east]{$A(\xA,\yA)$};
\draw[fill=white] (\xB,\yB) circle (1.75pt) node[anchor=north]{$B(\xB,\yB)$};
\draw[fill=white] (\xC,\yC) circle (1.75pt) node[anchor=east]{$C(\xC,\yC)$};
\end{axis}\end{tikzpicture}\end{document}